
The Test
Chen Liu was the kind of engineer who printed things out. In the 2010s, this made him an oddity at the company — a place where developers prided themselves on never touching paper. But Chen printed everything. Stock charts. Competitor websites. Error logs. He’d spread them across his desk like a detective examining evidence. Which, in a way, he was.
The experiment had been running for six weeks. That’s what we called them — experiments. Never “features” or “updates.” Experiments. Because in our world, half the users saw one thing, half saw another, and a computer somewhere in a data center was keeping score. Sales up? You win. Sales down? You lose. Simple as baseball statistics, except the stakes were twenty million in quarterly revenue.
We ran our own A/B testing platform. We’d built it ourselves, back when the company still thought testing was what you did in QA. “We’re not guessing anymore,” we’d told SLT at the time. “We’re measuring.” We put a team on it and have been A/B testing for years now.
The new product grid was supposed to be our breakthrough. Client-side rendered — the first time we’d tried it. The old grid loaded from the server, clunky and slow. The new one? Lightning fast. Engineering had spent 8 weeks on it.
“It’s failing,” Sarah announced at the Tuesday standup. She had that tone — the one that meant she’d already checked the data three times.
Mike, our product manager, started clicking his pen. He’d come from Amazon, where he’d learned that every failed experiment meant someone was updating their résumé. “How bad?”
“Eight percent drop in sales on B.”
Mike clicked faster.
“Run it again,” I said.
Sarah’s fingers flew across her laptop. The beauty of our system — she could restart the experiment with five keystrokes. Another few hundred thousand users would be randomly assigned. Half would see the old grid. Half would see the new one. The computer would watch what they bought.
Week two: Still losing.
Week three: Sarah tweaked the design. Different colors. Bigger buttons. Still losing.
By week six, other teams were complaining. See, when you run an experiment on a major piece of code, you maintain two versions. Anyone making changes has to update both. It’s like renovating a house while living in it and also maintaining an exact replica next door. Engineers hate it.
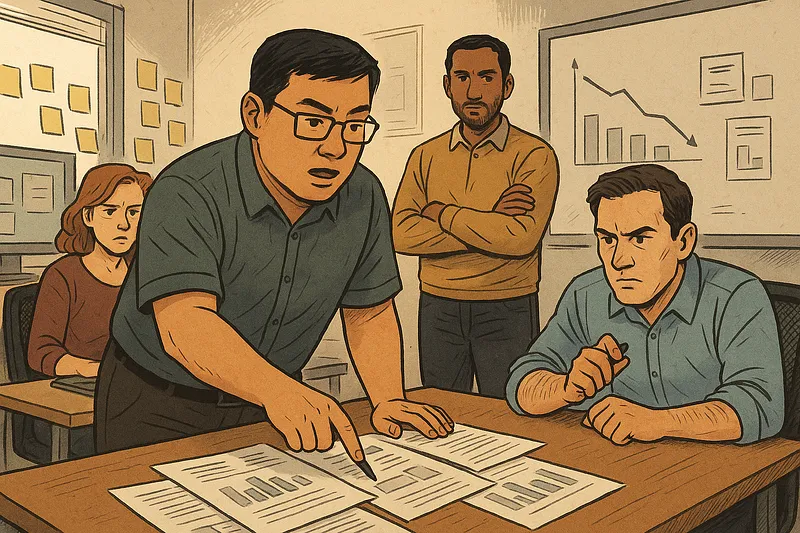
Thursday morning. Chen walked into the conference room carrying a stack of printouts. Real paper. Mike stopped mid-click.
“I found something,” Chen said. He has this way of talking — quiet, measured, like he’s calculating the weight of each word. “Look at the segments.”
Sarah pulled up her dashboard. We could slice the data a thousand ways. Browser type. Geography. Device. Time of day. She’d already checked them all.
“No,” Chen said. “Deeper.” He spread his printouts on the table. Screenshots of Chinese and South East Asian e-commerce sites. “Look at their price columns.”
PM’s like Mike from Silicon Valley, had a blind spot. They design for themselves — English speakers with college degrees and high-speed internet. But Chen had noticed something. On every local competitor’s site in China and Indonesia, the price column stood alone. Clean. Uncluttered. Our new grid? We’d put the quantity dropdown in the same column as the price. Elegant, we thought. Efficient.
“China. Chinese language browsers only.” Chen pulled up Sarah’s dashboard and filtered. “Down fifteen percent.” Another filter. “Indonesia. Indonesian language only. Down twelve percent.”
The room went quiet. Mike had stopped clicking entirely.
“It’s not the English speakers in those countries,” Chen continued. “They’re fine. It’s the local language users. So I guess less educated. More price sensitive. They need to compare prices quickly, and we made it harder.”
Sarah was already typing. In the old days — before we tested everything — we would have argued for hours. Someone would have mentioned Steve Jobs and intuition. Someone else would have cited user research. In the end, the highest-paid person’s opinion would win.
Not anymore.
“I’ll move the dropdown,” Sarah said. “Give me two hours.”
Two hours and fourteen minutes later, the new variant went live. Hundreds of thousands of new users randomly assigned. The computer watching. Counting.
Tuesday. Sarah pulled up the dashboard.
The lines on the graph converged. Perfect parallel tracks. No difference. We weren’t losing anymore.
“Take it,” Mike said. His pen clicking resumed, but it sounded different. Celebratory, almost.
Here’s what would have happened without the testing platform: We would have shipped the new grid to everyone. Revenue would have dropped. We’d blame the economy, or competition, or seasonal factors. The real reason — that we’d made it harder for price-sensitive customers in China and Indonesia to compare products — would have remained invisible. A million-dollar mystery over time.
Chen kept those printouts. I saw them in his desk months later, folded and worn. When I asked why, he shrugged. “To remember,” he said. “To remember what we almost didn’t see.”
The testing platform saved us, but only because Chen printed those pages. Only because he looked beyond the aggregate numbers to the human behavior underneath. You can instrument every click, measure every conversion, but somewhere in that data is a person trying to buy something. And if you make it harder for them — even by putting a dropdown in the wrong column — they’ll go somewhere else.
That’s what they don’t tell you about agile development. It’s not about moving fast or breaking things. It’s about responding to change. And the tools to find out before it’s too late.
Start with testing. Always start with testing. Your North Star metric doesn’t care about your opinions, start with testing that, in ecommerce its usually sales, you can also look at funnel step conversion, but it maybe something different for you, but once you find it test everything on that.