
Knowing It’s Fixed: How to Actually Validate a Performance Improvement
Or: Shipping a Fix Is Not the Same as Knowing It Worked

Namfon had shipped the new page on a Tuesday. The vinyl floor on level 6 was catching the afternoon light the way it does when the day has gone well — that particular low-angle Bangkok gold that comes through the floor-to-ceiling glass around 4pm — and the dashboard looked exactly right. LCP was green. Load time was green. She’d built the thing, measured the thing, and the numbers confirmed what she already suspected: it was fast. She marked it done and went home.
The complaints started the following week. Not a flood — a trickle, the kind that’s easy to dismiss as users being users. The page felt slow. Something wasn’t loading. It took ages to see anything useful. We pulled up the dashboards. Everything was green. We pulled up the RUM data. Still green. For a day or two, we assumed the users were wrong.
Then someone opened Chrome’s performance tooling and actually watched the LCP marker fire. It landed at 800 milliseconds — crisp, fast, exactly what you’d want. The problem was what was on screen at 800 milliseconds: the header. The navigation bar. A page shell that looked like a page but contained nothing a user could act on. The data table — the entire reason anyone opened this page — arrived 1,300 milliseconds later. On the office network. For real users on real connections, it was worse. We’d been measuring the arrival of the furniture and calling it the arrival of the meal. The compass had said we were on course. We weren’t anywhere near the destination.
This is the third and final post in this series. Post 1 covered instrumentation — how to measure the right things for your actual users, not just the metrics your tooling defaults to. Post 2 covered intervention — where to look for the real performance levers in a modern frontend stack. This post covers the part nobody talks about honestly: how do you know the fix worked?
Why CI Can’t Close the Loop
The obvious answer is CI performance benchmarks — fail the build if LCP exceeds a threshold, same as you’d fail it for test coverage. And CI benchmarks are worth having. They catch egregious regressions before they reach production. They’re a useful signal.
But they have a fundamental limitation that’s worth being honest about: CI cannot replicate production conditions.
The factors that actually determine real-user performance — device diversity, network variance, CDN cache state, concurrent server load — are all invisible to CI. Your benchmark runs on one machine, with one network, with a clean cache.
If you’re running A/B tests, the problem compounds. Your CI pipeline tests variant A — the control, the safe default. The change you’re trying to validate is behind a feature flag that’s off by default. Your Lighthouse score looks pristine. Your synthetic test is green. Production is not your CI environment.
There’s a practical workaround: force a single variant in CI and run your performance suite twice on high-priority changes — once with all-A variants, once with the PR’s variant as B. Compare the two runs. This doubles CI time for those runs, so you do it selectively, not universally. It’s a useful regression detector. It is not a reliable answer to “did this help?”
A/B Testing Is the Validation Layer
Here’s the thing most teams don’t realise: if you’re already running A/B tests for product experiments, you already have the infrastructure to validate performance work. You just aren’t using it that way.
The only reliable method for knowing whether a performance change improved the real-user experience is to show the change to a slice of real users and compare their experience to a control group simultaneously, under the same conditions, at the same time. That is exactly what A/B testing does.
There’s a subtlety here worth stating explicitly: if you’re running multiple experiments concurrently — and at any mature product company, you are — a post-deployment snapshot can’t isolate your change from everything else happening in production. An A/B test can. Because both variants see the same traffic, the same device mix, and the same concurrent experiments at the same 50/50 split, any external factor affects A and B equally. It cancels out. What’s left is the signal from your change alone. That’s the property that makes it reliable in a way no post-deploy chart can match.
The leap is treating performance metrics the same way you treat conversion or engagement: as tracked outcomes in the experiment. If your experimentation platform can split users across variants — and it can — it can split them across “old code” and “performance-improved code.” Add LCP, INP, or your custom metrics as outcomes alongside your product metrics. Now you have a simultaneous comparison with real users under real conditions, not a synthetic test on a single machine.
At Agoda, we integrated Web Vitals telemetry directly into our A/B testing system. Every experiment running in the product produces a per-variant performance comparison automatically. The effect of this is twofold: performance regressions in new features are caught at experiment ramp-up, before full launch. And performance improvements ship with evidence — actual numbers from real users, not a favourable post-deployment snapshot that might be explained by a traffic shift you didn’t account for.
The honest cost is time. A/B tests need to reach statistical significance before you can draw conclusions. A small improvement on a low-traffic page might take weeks to produce a confident result. That is the trade-off: you exchange speed of certainty for accuracy of certainty. For a team that’s been making performance decisions based on charts that might be telling them what they want to hear, it’s a trade worth making.
The Regression You Won’t See
Standard Web Vitals — LCP, INP, CLS — are well-validated metrics for consumer web contexts. For B2B or data-heavy applications, a meaningful regression can be completely invisible to all three, while significantly degrading the experience of the users the product exists to serve.
The scenario: you ship a change that makes a backend data query two seconds slower. The page has a header, a navigation bar, and a large data table.
- LCP fires when the header — the largest element in the initial render — has painted. The data hasn’t arrived yet. LCP reports clean.- INP is unaffected. Click responsiveness hasn’t changed.- CLS is unaffected. Nothing shifted. Every standard metric is green. The user is waiting two extra seconds for the data they opened the page to act on. The regression exists; it’s invisible to the instruments you’re using. See real below example:
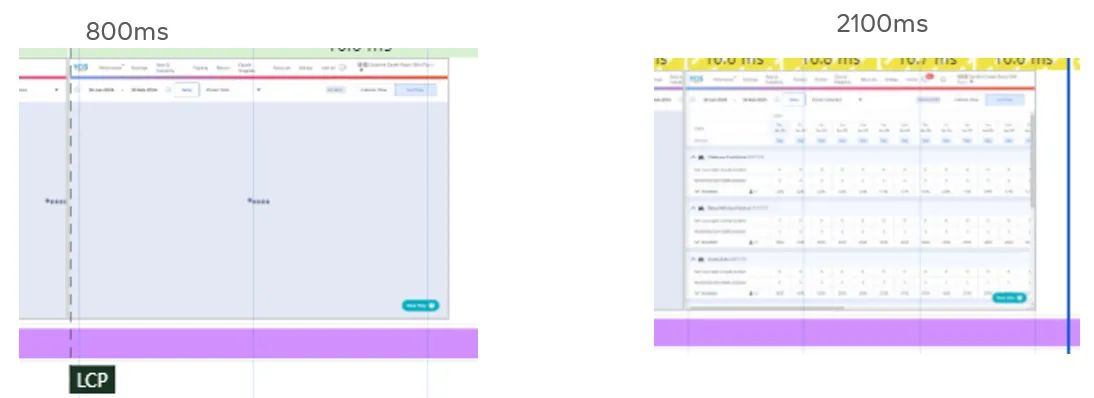
This is the problem that motivated what we call the Critical Mark — a developer-nominated readiness marker that fires when the primary data component mounts. Not when the page shell loads. When the content the user needs is actually present.
On one of our extranet product pages, LCP fires when only the page header has loaded. The data table — the content the page exists to provide — isn’t there yet. LCP reports a healthy metric. Critical Mark, attached to the data component, fires significantly later. The gap between those two numbers is the measurement error that would have been invisible without the custom instrumentation.
This is the case for custom performance metrics: not as a replacement for standard ones, but as a supplement that covers the gap between “page rendered” and “user can do their job.” As we covered in Post 1 of this series, the right metric is the one that reflects actual user workflows in your actual application — and sometimes you have to build it yourself.
Disciplined Restraint: Knowing When Not to Ship
The most mature version of “knowing it’s fixed” is recognising when you don’t have enough evidence to act.
We ran proof-of-concept work on Compression Dictionary Transport (CDT) — a newer HTTP standard that uses a browser’s cached version of your previous bundle as a compression dictionary to dramatically reduce the payload size of subsequent deployments. The technology is real and validated at scale: Google Search reported around 23% payload reduction when adopting it. The promise for teams with frequent deployments is significant — each deploy is cheaper for users who already have an older bundle cached.
The expected signal for CDT benefit is a performance dip around deployment time: the window when users first encounter a new bundle version before their browser has built the dictionary from the old one. We looked for this signal in our aggregated performance data. We couldn’t clearly see it. The dip either exists but isn’t visible through our current data aggregation approach — we’d need to look at a much tighter time window around specific deployments rather than daily aggregates — or Agoda’s specific deployment patterns don’t produce the problem CDT would solve at the scale the technology’s benefits would justify.
The team’s position: find the problem clearly before deploying the solution.
This is an underappreciated form of engineering discipline. The instinct, when promising technology appears, is to adopt it. CDT is good technology. The evidence that it works is credible. But “this technology works” and “this technology solves our specific problem” are different claims, and we hadn’t established the second one. Optimising into the unknown — shipping a performance improvement you can’t measure the effect of, hoping the numbers improve — is the validation failure in reverse.
As the statistician W. Edwards Deming put it: “Without data, you’re just another person with an opinion.” That applies as much to the decision to ship a performance optimisation as it does to the decision not to.
Closing the Loop
The three posts in this series describe a single loop:
Instrument correctly. Real User Monitoring, the right metrics for your users and application type, at the right percentile for your noise floor. Custom markers where standard metrics don’t reach.
Find the right lever. BFF parallelism, loading state sequencing, bundle composition. Fix the things that actually matter for your users, not the things that are visible in synthetic tests.
Validate reliably. A/B testing as the production validation layer. Custom metrics as regression detectors. Disciplined restraint when you can’t see the problem clearly enough to act on it.
The loop doesn’t close unless all three work. The research on high-performing engineering teams — Forsgren, Humble and Kim’s Accelerate being the most rigorous — consistently shows that measurement practices are what separate teams that improve from teams that just stay busy. Teams that measure well but fix the wrong things waste engineering effort. Teams that fix the right things but can’t validate whether they worked are navigating with a broken compass. Teams that validate well but don’t have the right instrumentation will miss regressions that happen in the gap between “page loaded” and “user can work.”
Performance is not a feature you ship. It’s a practice you maintain — and like any practice, it only improves when you’re honest about what you actually know versus what you want to believe.
Back on level 6, the dashboards were still green when we found the problem. Namfon hadn’t done anything wrong — she’d measured exactly what the tooling told her to measure, and the tooling had been measuring the wrong thing. What the Chrome performance trace gave us wasn’t a fix — it was the discovery that our instrumentation had been lying to us, probably on more pages than just this one, and that fixing it would be worth more than any individual performance win. We built the Critical Mark. We added performance outcomes to our experiment results. We stopped calling things done until we were sure we were measuring what users actually experienced.
The compass works now. Mostly.