
Introducing DX Telemetry Manager
Or: An Open Source Dashboard for the Developer Inner Loop
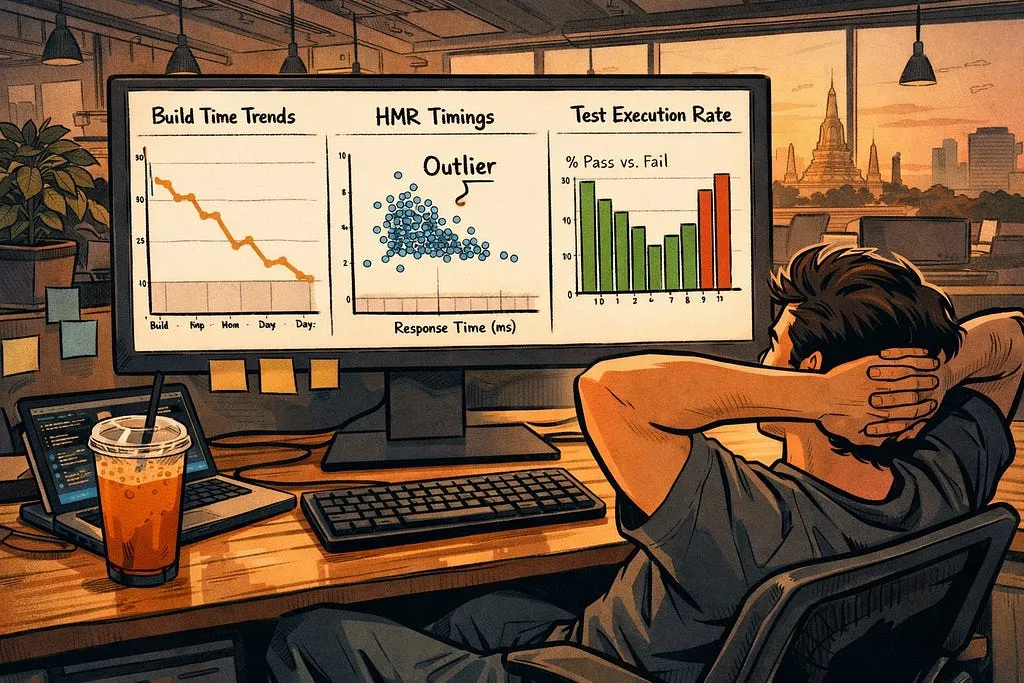
There’s a particular satisfaction to the moment a dashboard shows you something you didn’t know you were missing.
It was somewhere around the third week after the first rollout. We were looking at the clientside build data — not for any specific reason, just following the numbers — when three engineers showed up as consistent outliers. Nearly double the median webpack build time. Every day. Reproducibly. We pulled the hardware correlation. Seventh generation Intel chips. Laptops that hadn’t been renewed in three years. Nobody had filed a ticket. Nobody had flagged it in a retro. The engineers themselves had adapted to it so completely that slow had become their normal. We immediately got them replacement laptops.
We had built a tool to measure local build times. It found a hardware equity problem. That’s what happens when you make the invisible visible: you find the thing you didn’t know to ask about.
We’ve now open-sourced everything — the dashboard, the collection clients, all of it. This post is about what it is, how it works, and how to get your own data flowing.
If you want the full story of why the inner loop matters and what we found when we started measuring it properly, start with The Inner Loop Nobody Measures and What We Actually Instrumented — and What We Found. If you’re here for the tool, read on.
What This Is
Agoda DevExTelemetry is an open-source dashboard that collects, stores, and visualises developer inner loop telemetry — build times, startup times, HMR times, test execution rates — across .NET, JavaScript/TypeScript, and JVM stacks. It’s not what we use, we use our data platform on prem, which is slightly hard to open source :) so I built this so small companies can run something simple on their infrastrucutre to get going faster with monitoring dev local metrics.
It is specifically not a CI monitoring tool. CI tells you about the outer loop: clean builds, controlled environments, hardware nobody develops on. This tells you what the engineer at the laptop actually experiences, every debug cycle, every day. Those are different measurements. As we learned with Somchai’s five-minute debug cycle hiding behind a 30-second compile metric, the gap between them is where the real problems live.
The system has three parts:
- Collection clients — build and test reporter plugins that run automatically alongside normal development, zero friction for engineers- A central ingest API — receives timing and hardware data from client machines and stores in sql-lite- A dashboard — makes the data visible, queryable, and comparable across teams and over time from teh same database All three are open source. The clinet collect and part of teh ingestion API are running across roughly 700 engineers at Agoda. The ingestion API is “based” on the API we use internally at Agoda, and we’ve done some of the same performance optimiztions on it as well.
Architecture
Simple by design. The goal was something any team could deploy without dedicated infrastructure or a platform team standing it up.
- Backend: .NET 10, ASP.NET Core (Kestrel), EF Core with SQLite- Frontend: React 19, TypeScript, Vite 8, Tailwind CSS 3, Recharts- Deployment: GitHub Actions → Azure App Service (Linux); or self-host anywhere .NET runs. You can take the artifact or docker image and use it yourself inside your company. SQLite keeps the operational footprint minimal. No separate database to provision, no connection strings to manage, no infrastructure dependency for most team-scale deployments. It’s one of those architectural choices that looks aggressively simple until you realise that simple is the point — the goal is to remove every possible reason not to deploy it.
What Gets Collected
The ingest API accepts telemetry from all three stacks via dedicated endpoints:
Endpoint What it receives POST /dotnet .NET compile time, ASP.NET startup time, time to first response POST /dotnet/nunit NUnit / xUnit test results and durations POST /webpack Webpack full build time and HMR time POST /vite Vite full build time and HMR time POST /jest Jest test results POST /vitest Vitest test results POST /junit JUnit test results POST /scala/scalatest ScalaTest results POST /gradletalaiot Gradle Talaiot build metrics
The .NET endpoint collects three separate metrics — compile, startup, and first response — because each degrades independently. Combining them into a single "build time" would have hidden the Somchai problem entirely. Startup finishing doesn't mean the service is ready. First response time is the number that actually matters to the engineer staring at the browser.
The hardware metadata collected alongside build timings is what made the laptop correlation possible. Without knowing what machine each build ran on, fast and slow are just numbers with no explanation.
The Collection Clients
.NET
dotnet add package Agoda.Builds.Metrics
dotnet add package Agoda.DevFeedback.AspNetStartup
dotnet add package Agoda.Tests.Metrics.NUnit   # or .xUnit
The MSBuild plugin hooks into the build pipeline automatically — no registration, no config file, no ceremony. The ASP.NET package instruments startup time and time to first response as separate metrics. After the next build, data starts flowing.
The right home for these packages is your paved path .NET template. Wire them in at the template level and every new service comes instrumented by default. Engineers don’t need to think about it.
JavaScript / TypeScript
npm install agoda-devfeedback-vite2
# or
npm install agoda-devfeedback-webpack
Add the plugin to your Vite or webpack config — one line. HMR timing starts flowing alongside full build time. HMR is the metric CI has never seen and never will: it only exists on local machines, it degrades silently as dependency graphs grow, and it has an outsized effect on frontend developer experience. When HMR drifts from 200ms to 800ms over three months of normal feature development, no pipeline metric catches it. This does.
If you’re running the .NET BFF with Vite setup, the Vite plugin drops in cleanly alongside the existing config.
JVM
# Gradle Talaiot plugin, JUnit, ScalaTest clients
# github.com/agoda-com/java-local-metrics
JVM coverage exists and is open source, but it’s the least mature of the three stacks — it hasn’t received the same investment as the .NET and JS clients. If you work primarily in Kotlin, Scala, or Java, contributions are open and genuinely welcome. The JVM ecosystem deserves the same quality of inner loop telemetry as .NET and JavaScript.
Pointing the Clients at Your Deployment
Two options, depending on how much configuration you want to manage per machine.
Option A — environment variable:
export DEVFEEDBACK_URL=https://your-devex-telemetry.example.com
Set it in your shell profile or your team’s standard dev environment setup script. Data flows on the next build.
Option B — internal DNS:
Create a DNS record that resolves to your deployment. Zero per-machine configuration. Preferred for larger teams where you want the telemetry to be truly invisible — engineers don’t set anything up, the data just arrives.
The clients default to http://compilation-metrics make this resovle with your local DNS to where ever you host the API.
Either way, from installation to first data point is measured in minutes, not days.
What the Dashboard Shows
Three views, corresponding to the three inner loop problem areas.
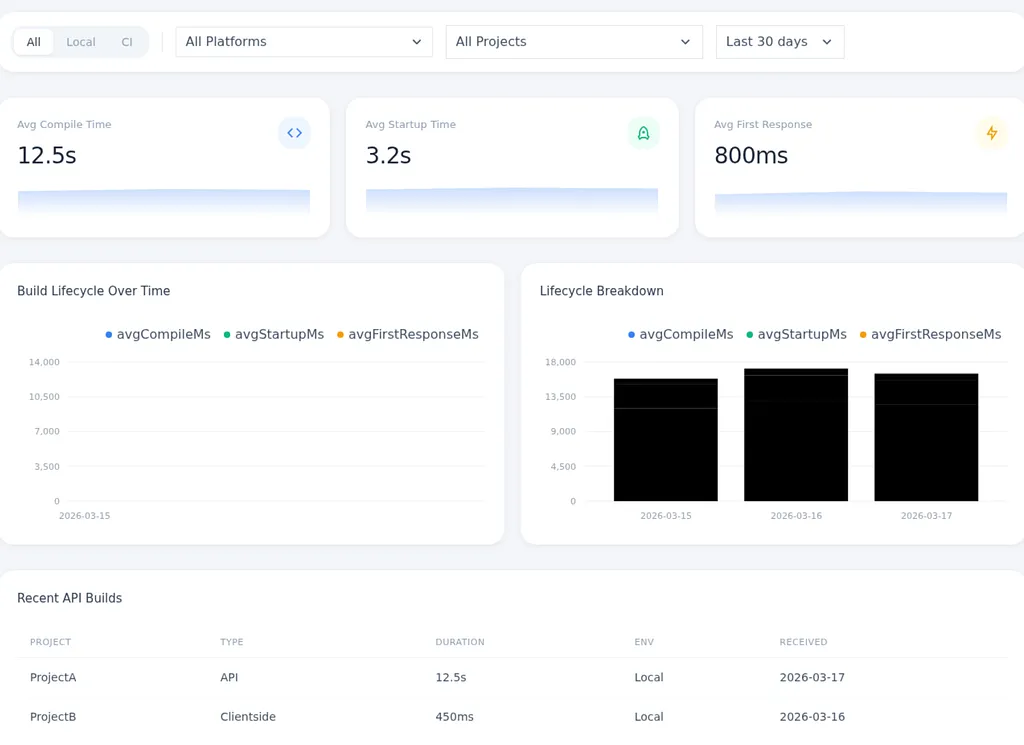
API Build Performance — compile time, startup time, and time to first response for .NET services, charted separately. This is where the Somchai story lives visually: a compile metric that looks fine sitting next to a first response time that tells a completely different story. P50, P75, P90 breakdowns over time, filterable by service and by team.
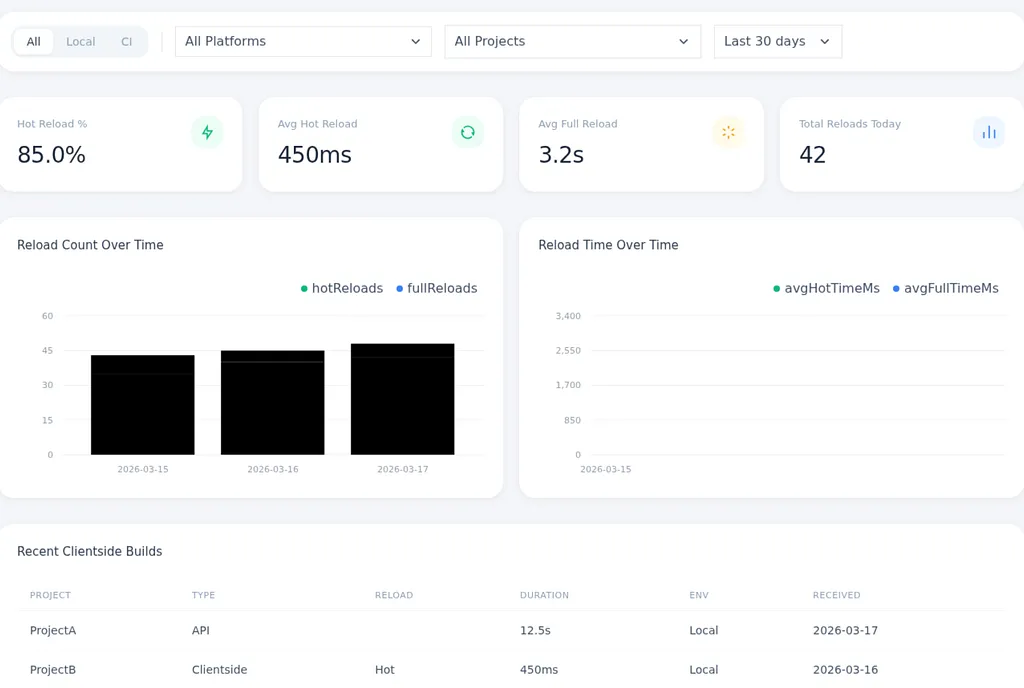
Clientside Build Performance — HMR time versus full build time for webpack and Vite, with hardware correlation available. This is the view that found the laptop problem. When three engineers show up as consistent outliers and you can correlate their build times against their hardware specs, the chart does the work that no retro conversation ever would.
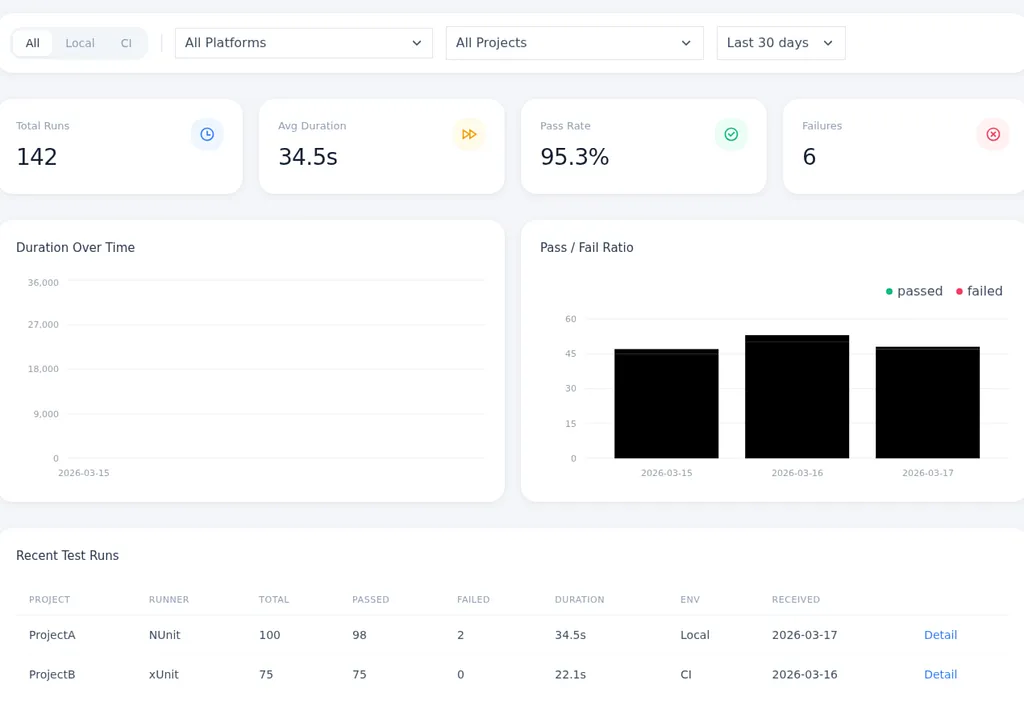
Test Run Performance — pass rates, durations, per-suite and per-test drill-down, and — critically — local versus CI execution rate comparison. The execution rate view is where you find the test suites that are green in CI and abandoned in practice. If a suite has a 15% local execution rate on days with active development, that’s not an engineering discipline problem. That’s a friction problem. The data tells you which suites, and the comparison against CI tells you the gap.
Ownership, Not Surveillance
One thing worth naming directly, because it comes up: the dashboard doesn’t tell teams what to do. It makes data visible. What teams do with it is their call.
This follows the same model as production monitoring. You wouldn’t centralise incident response into a platform team and have product teams ignore their own Grafana dashboards. The inner loop deserves the same ownership structure: the team that built the service is the team that runs it, and the team that runs it should own what their developer experience actually looks like. The platform provides the tooling. Teams own the signal.
The teams that have engaged with this most have done so because the data gave them something concrete to take to a conversation — not “our builds feel slow” but “our first response time is 4 minutes 47 seconds at P75 and three months ago it was 40 seconds.” That’s a number with a history. It creates accountability without requiring anyone to feel accused.
The Semantic Monitoring post covers the same philosophy applied to production systems. This is the development-side complement: the same argument, one loop earlier in the cycle.
Get Started
Repos:
- Dashboard: https://github.com/agoda-com/Local-Dev-Telemetry-Manager- .NET clients: https://github.com/agoda-com/dotnet-build-metrics- JS clients: https://github.com/agoda-com/devfeedback-js- JVM clients: https://github.com/agoda-com/java-local-metrics Install the clients, point them at a deployment, and data starts flowing on the next build. The hardest part is genuinely the deploy, not the instrumentation. And for most teams, a single Azure App Service instance on the free or basic tier handles team-scale data without breaking a sweat.
If you find something interesting in your data — a correlation we haven’t thought to look for, a problem the tooling surfaces that we didn’t anticipate — open an issue or start a discussion. The laptop finding wasn’t in our design spec. The abandoned test suite finding wasn’t either. Good observability keeps surprising you.
The Full Series
- The Inner Loop Nobody Measures — why the inner loop is a black box in most engineering organisations, and why that’s a problem worth solving- What We Actually Instrumented — and What We Found — what we measured, how the collection works, and what the data found that we weren’t looking for- Introducing Agoda.DevExTelemetry — you’re here
Related Reading
- Bridging Worlds: Making .NET BFF and React/Vite Play Nice in Development — the BFF and Vite setup the frontend telemetry instruments- Stop Copying Prod Into Dev: Test Data Strategies That Actually Scale — what the telemetry found; what this post fixed- Starting a Paved Path with .NET Templates — where the telemetry clients belong in the paved path from day one- Semantic Monitoring: The Question You’re Not Asking About Your Production Systems — the production-side complement to this series- Mesh Programming: Where Visual Design Meets Synchronized Development — why inner loop speed directly affects collaborative design-engineering workflows- The Impact of Paved Paths and Embracing the Future of Development — the broader paved path philosophy this tooling sits inside