
A Brief History of Web Performance at Agoda
Or: What Ten Years of Measuring the Wrong Things Taught Us About Measuring the Right Ones

The dashboard was green. Every metric we cared about was sitting comfortably within target. It was a Tuesday morning on level 6, the air conditioning was losing its daily battle with the Bangkok heat, and someone had made fresh Thai tea in the kitchen — you could smell the condensed milk from three desks away. I was looking at the numbers with the quiet satisfaction of someone who genuinely believed they understood what was happening in production.
We didn’t. The users were staring at an empty React shell while our DOM load metric cheerfully reported that everything was fine. The measurement infrastructure we’d built and trusted for years had silently stopped measuring anything useful, and the numbers had stayed green the whole time.
That’s the honest version of how this story starts.
What follows isn’t a “here’s how we do performance” post. Those posts describe a tidy current state — the architecture diagram, the metrics that matter, the tools you should adopt. This is the other kind: the version with the abandoned experiments, the wrong turns, the metrics we built before the industry had names for them, and the debates that ran twice and reached opposite conclusions. It’s a history of how a team figured out, iteratively and sometimes painfully, what “fast” actually means for users — and how to measure it honestly.
If some of this sounds familiar, that’s the point.
Phase 1: DOM Load and Boomerang (2016)
Agoda’s first serious investment in Real User Monitoring came in 2016, built around a fork of Yahoo’s Boomerang library — one of the foundational open-source RUM tools, a direct descendant of Steve Souders’ pioneering work on web performance in the mid-2000s. At the time, Agoda was server-side rendered. Boomerang injected a lightweight JavaScript agent into every page, collected browser timing events, and fed the data into Agoda’s internal analytics platform.
The primary metric was DOM load event time. For a server-rendered page, this is a reasonable proxy for “the page is usable.” The server sends HTML, the browser parses it, the DOM loads, and the content is there. Simple, defensible, and — as long as your architecture doesn’t change — correct.
The integration that proved most valuable wasn’t the metric itself but where the data landed. Performance data flowed into Agoda’s A/B testing infrastructure from the start. Every experiment automatically generated a performance comparison between variants. That decision — treating performance as a first-class output of every test, not a separate concern — shaped everything that came after.
The percentile debate, first iteration
When you have real user data across thousands of sessions you immediately face the question: which number do you actually report? Median? 75th percentile? 90th?
Agoda settled on P90 as the primary optimisation target, and the reasoning was worth understanding. At Agoda’s traffic scale, even a small percentage improvement on the slower end of your distribution represents a large absolute number of users. The tail at P90 — the slowest tenth of your users — is also the group most likely to abandon. Improving their experience can deliver more commercial impact than shaving milliseconds from the median.
The counterargument at the time was that P90, on mid-2010s mobile networks and hardware in Asia, was dominated by noise — bad connections, underpowered devices, unusual browser states. Optimising for P90 was, some argued, optimising for chaos rather than for real user behaviour. There was a point to that. In practice, Agoda split: P75 for SLAs, P90 and P50 as additional lenses for experimentation. The debate wasn’t resolved so much as it was made productive.
Phase 2: Synthetic Monitoring and the Competitor Charts (2017)
In 2017, Agoda deployed a fleet of synthetic monitoring agents in offices worldwide. The goal was appealing: approximate real geographic user experience without waiting for RUM data to accumulate, and catch regressions before users ever saw them.
The operational reality was a maintenance problem. Agents needed regular restarts. Power outages in remote offices took monitoring nodes offline without obvious signals. State accumulated and required periodic reloading. Running a global fleet of monitoring machines is infrastructure work — and it doesn’t naturally belong to a product engineering team. Eventually the experiment was abandoned.
But synthetic monitoring did one thing that RUM fundamentally cannot: it could load any URL, including competitors’.
Agoda pointed the agents at Booking.com, Expedia, and Airbnb alongside internal pages. Every bi-weekly performance review, engineers saw Agoda’s load time plotted on the same chart as the competition. The question stopped being “did we hit our target” and became “are we faster than Airbnb yet?”
Robert Cialdini, whose work on influence and social behaviour remains some of the most practically useful psychology written in the last fifty years, found that people are far more motivated by knowing where they stand relative to others than by knowing where they stand relative to a target. Abstract millisecond improvements are hard to make feel meaningful. A race against a named competitor is not. Engineers knew exactly who they were chasing and roughly where the gap was. Goals had faces.
We caught Booking.com on mobile load time for a period. Airbnb stayed ahead of us longer than we’d like to admit — they were genuinely good at this. But the charts kept people honest in ways that internal targets rarely do.
The synthetic fleet is gone. The insight isn’t. Tools like WebPageTest let you run competitor benchmarks today without maintaining your own agent infrastructure — the fragile part of the experiment turned out to be separable from the valuable part.
Phase 3: React, the DOM Load Problem, and Critical Mark (2018)
When Agoda migrated to React, DOM load time stopped being useful as a primary metric. The initial HTML document is a shell — it loads quickly, because there’s nothing in it. JavaScript bundles then load, parse, and execute. React renders. Data fetches complete. The content the user actually came for appears. DOM load fires long before any of this is done.
The metric looked excellent. Users were waiting.
This is the gap that browser timing events don’t cover: the difference between “the page shell loaded” and “the user can start working.” In 2018 — two years before Google launched Core Web Vitals — Agoda built a custom metric to fill it.
We called it the Critical Mark.
The implementation was deliberately simple: a Higher-Order Component that injects a callback prop. Engineers nominate one component in each page’s tree as the readiness point — typically the primary data payload, the hotel list, the search results, the booking summary. When that component mounts, a RUM timing event fires and lands in the same infrastructure as every other performance measurement.
One HOC wrap. One nomination per page type. A metric that answers the question users actually care about.
The data connected directly to A/B testing, as DOM load data had before. Every test continued to produce a performance comparison. The metric predated the industry equivalent, was built to solve a specific gap, and quietly became load-bearing for how Agoda thought about performance.
Phase 4: Google Core Web Vitals — Adoption and Adaptation (post-2020)
Google launched Core Web Vitals in 2020: Largest Contentful Paint, Cumulative Layout Shift, and First Input Delay. For most web products, LCP does something very similar to what Critical Mark was doing — measuring when the primary content element is visible to the user.
Agoda evaluated the web-vitals.js library and adopted it, but not off the shelf.
The fork added two things. First, internal telemetry routing: Web Vitals events flow into Agoda’s own data platform, sitting alongside product analytics and A/B testing data in the same system. Second, per-variant performance comparison: every experiment now automatically outputs Web Vitals comparisons alongside product metrics. This, again, is the most reliable way to know whether a change genuinely improved performance — not synthetic tests, not CI analysis, but real users split across controlled variants experiencing the actual product.
At this point the original Critical Mark was retired for the consumer product. LCP, and later INP (which replaced FID in 2024 as a Core Web Vital), covered consumer ecommerce well enough. The custom metric had been superseded — at least for that context.
The percentile debate, second iteration
The same question came back around, and this time it inverted. The argument in 2016 had been “P90 is too aggressive, the tail is too noisy.” By the early 2020s, the network and hardware landscape had shifted. Mobile connections were better. The P90 tail was less dominated by chaos and more representative of real users with real devices on real networks who could genuinely benefit from engineering work.
The question had flipped: not “should we lower the target” but “should we go further than Google’s P75 recommendation?” Agoda stayed at P75 as the primary SLA, but P90 continued as an active lens in some teams. The answer depends on your context. The debate being worth having at all says something useful about how much the landscape had changed.
Phase 5: The B2B Extranet Project and Critical Mark Returns (2022)
In 2022, a dedicated performance initiative launched for Agoda’s B2B extranet — the platform hotel partners use to manage inventory, pricing, and promotions. The scope was deliberately cultural as well as technical, and that wasn’t an accident — it came directly from what the frontend performance team had learned working through all of the phases above on the main consumer funnel.
The lesson they’d arrived at the hard way: you cannot have one team that owns performance, fixes performance, or even improves performance in isolation. If no one else cares about it, everyone else makes it worse, and you end up with a single team perpetually trying to fix the mistakes of every other team shipping code. Worse, the moment you have a dedicated performance team, people tend to develop the attitude of “don’t we have a team for that? why is it my problem?” The performance team needs to be an enabler and an educator: helping teams with tooling, setting SLAs, understanding how the DOM renders, explaining why this particular thing is slow. The knowledge has to spread, or it doesn’t hold.
The 2022 extranet project was built on that foundation. The team recognised that performance isn’t a team, it’s a culture, and the deliverable wasn’t just tooling — it was rolling out norms and practices to the engineering teams building extranet products.
Working on the extranet exposed a familiar gap. LCP fires when the page header and shell load, not when the data hotel partners actually need appears. A revenue manager opening a pricing page gets a “loaded” LCP signal while the rate table is still fetching. The metric the industry had standardised on was measuring the wrong thing for this context.
We began so see patterns like this:
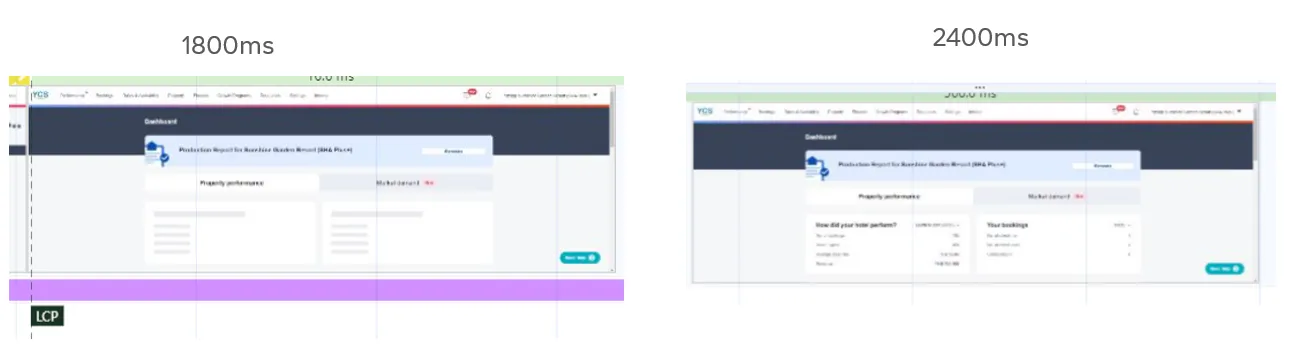
You can see on the left at 1800ms the LCP mark is hit, but the data isn’t there, the data comes almost a full second later.
And when we applied this to very data heavy complex pages, it’s even worse.
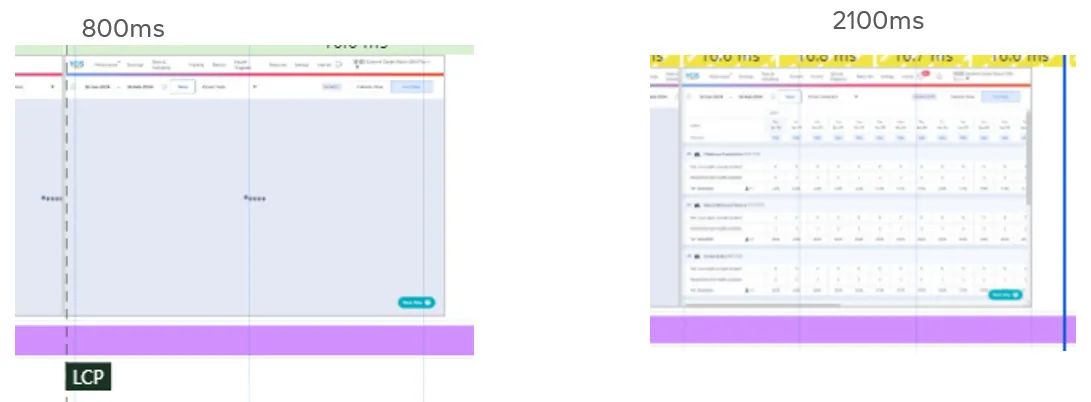
The solution was to reach back for Critical Mark. Same pattern, same HOC approach, applied to B2B pages where the primary content is a data table rather than a media element. It wasn’t rediscovered — it was deliberately retrieved.
There’s something worth noting in that arc. We built a metric before the industry had an equivalent, the industry eventually caught up, the industry standard superseded our custom metric for consumer ecommerce, and then we needed the custom metric again for a context the industry standard wasn’t designed for. LCP and Critical Mark now run alongside each other: LCP for tracking bundle optimisation impact and early page load characteristics, Critical Mark for measuring what hotel partners experience as “the page is ready.”
Phase 6: What We’re Exploring Now (2024–present)
Two things are currently in experimentation. Neither is in production. Both might fail, failure is always an option, but fail with learnings.
Compression Dictionary Transport (CDT) reduces the size of repeated JavaScript bundles by using a shared dictionary for compression. POCs are complete. Before committing to it, the team went looking for evidence of the problem it solves — a visible signal in LCP, Critical Mark, or other existing metrics that bundle size was meaningfully hurting users. So far that signal hasn’t appeared clearly in the data. The team’s position is straightforward: find the problem before deploying the solution. CDT is a validated technology. Deploying it without evidence that you have the problem it solves is optimising into the unknown.
Zephyr Cloud edge tree shaking addresses a different structural issue. Agoda runs a significant number of live experiment variants simultaneously. JavaScript bundles carry code for all active variants — code the current user will never execute, because they’re assigned to only one variant of each experiment. Edge tree shaking strips dead-variant code at serve time based on the user’s experiment assignments. Agoda is Zephyr Cloud’s first on-premises customer; at the scale of infrastructure involved, the SaaS hosting model doesn’t apply. Zephyr calls it “Bring Your Own Infrastructure” — the on-prem deployment model runs on Agoda’s own infrastructure. The module federation underpinnings connect back to how we think about micro-frontend architecture more broadly.
These might work. They might not. We’ll test them properly and find out.
What the History Actually Teaches
If there’s a thread running through ten years of this, it’s something the physician and writer Atul Gawande captured well when writing about how medicine learns: “We have not asked surgeons to have the same results every time. We have asked them to have better results over time.”
That’s the honest version of what a performance programme looks like. Not a moment when you get it right. A series of iterations where you get it less wrong — because the technology changes, the architecture changes, the user base changes, and the metrics that were correct last year measure something irrelevant today.
DOM load was right until React made it wrong. Core Web Vitals were right for consumer ecommerce until they were wrong for B2B extranet. P90 was too aggressive until the networks improved and it wasn’t anymore.
The measurement infrastructure we trust today will need revisiting. That’s not a failure of the approach. It’s the approach working exactly as it should — measuring what users actually experience, not what servers report.
Now, if you’ll excuse me, I need to go check whether our Critical Mark nominations on the extranet are still pointing at the right components. I’m fairly certain one of them hasn’t been updated since the last redesign, which would mean we’ve been measuring the wrong thing confidently for several months.
Apparently some problems are perennial.